The Doomsday Equation
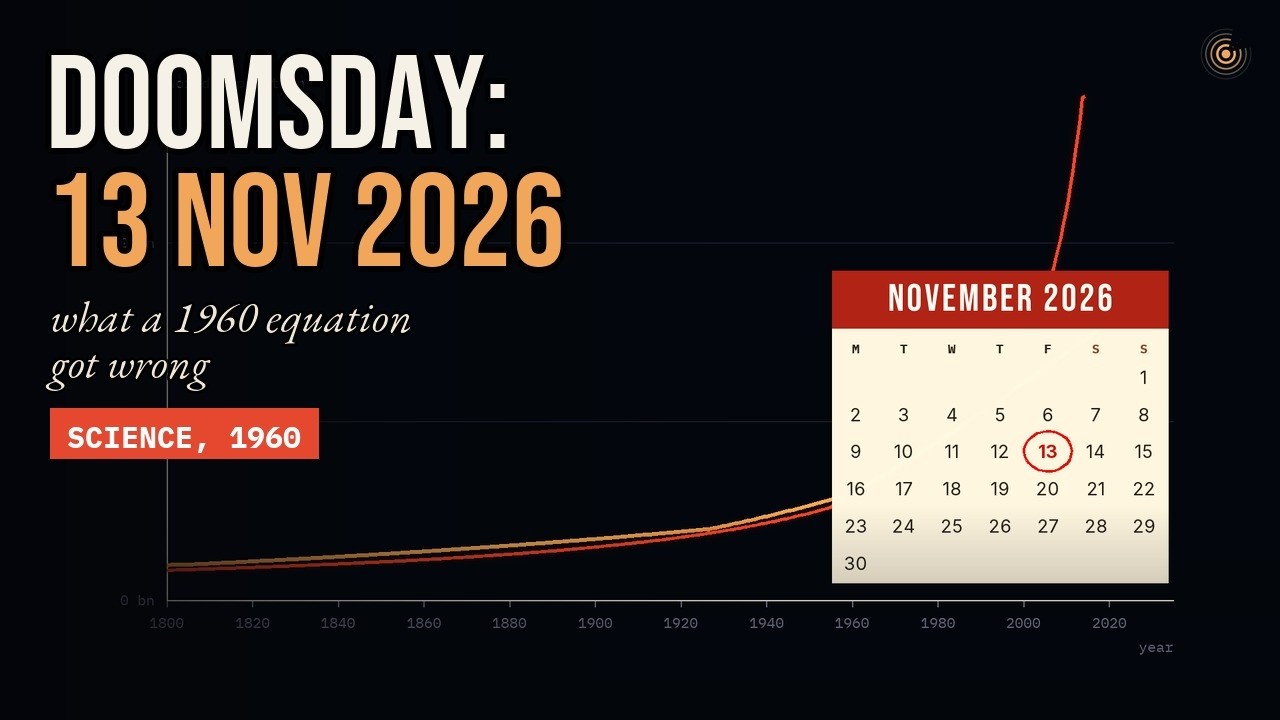
In 1960 the journal Science printed a date for doomsday in a paper's title: Friday 13 November 2026. The maths was serious, and for 30 years the world kept to the curve.
Urbana, Illinois, in the autumn of 1960. In a university laboratory, three people have spent months on a strange job. They have collected every estimate they can find of how many people were alive on Earth, from the time of Christ to their own day.
They plot the numbers. They fit a curve through them. And the curve does something a population curve is not supposed to do. It does not just climb. It runs out of time.
On 4 November 1960, the journal Science printed their result, with the answer in the title.
"Doomsday: Friday, 13 November, A.D. 2026."
That Friday falls this month. So were these three scientists cranks? Here is the strange part. For 30 years, the real world stayed close to their curve. Then, quietly, it swerved away. And what their equation got wrong turns out to be the most hopeful part of the story.
Three People and a Curve
The first author was Heinz von Foerster. He was born in Vienna in 1911, studied physics, and moved to the United States after the Second World War. At the University of Illinois he ran a laboratory for electron tubes. Then, in 1958, he founded something more unusual: the Biological Computer Laboratory.
Engineers, biologists and philosophers worked there on one big question: how do living things handle information? Von Foerster was one of the pioneers of cybernetics, the science of feedback, of systems that steer themselves by watching what they do.
His co-authors were two of his students, Patricia Mora and Lawrence Amiot. Their raw material was surprisingly modest: 24 estimates of the world's population, taken from encyclopaedias, almanacs, and the yearbooks of the League of Nations and the United Nations.
Counting people is ancient. Rulers always wanted to know how many subjects they could tax, or call up to fight. But nobody had ever counted the whole world. Every figure from before the 20th century is an estimate, pieced together from tax rolls, parish registers and educated guesswork.
Still, the rough shape is clear. 2,000 years ago there were perhaps a few hundred million people. It took until about 1800 to reach 1 billion. The second billion came by 1927. The third arrived around 1960, the very year the paper appeared.
Look at those gaps. 18 centuries for the first billion. About 120 years for the second. Just over 30 for the third. The wait for each new billion was collapsing. That is what caught von Foerster's eye. Not that the population was growing, but that the growth itself was speeding up.
Faster Than Exponential
To see why that matters, go back to an English clergyman, Thomas Robert Malthus. In 1798 he published An Essay on the Principle of Population, and set out a famous rule.
"Population, when unchecked, goes on doubling itself every 25 years, or increases in a geometrical ratio."
Geometric growth is what we now call exponential growth. The population doubles, and doubles again, at a steady pace. It gets enormous. But it never becomes infinite. Pick any year you like, and the answer is still a number.
Von Foerster's curve was different. In his equation, the doubling time was not fixed. It shrank as the population grew. In 1960, his curve had humanity doubling about every 30 years. By 1980, about every 20. And the closer you got to 2026, the faster the doubling came, until the doubling time reached zero.
Think of it as money in the bank. Exponential growth is a fixed interest rate: the money compounds, but the rate never changes. Hyperbolic growth is a bank that raises your interest rate every time your balance grows. The bigger you get, the faster you grow, until the sum runs away to infinity at one definite moment.
Mathematicians call that a singularity. Von Foerster's had a date. His best fit put it at the year 2026.87, give or take about 5.5 years. 0.87 of the way through the year is the middle of November. The paper's title named the day: Friday, the 13th.
And there is a detail the paper does not mention. 13 November was Heinz von Foerster's own birthday. Was the date partly a joke? We cannot be sure. But it is hard not to smile.
Squeezed to Death
But why should growth speed up at all? Animals in a closed space do the opposite. Fruit flies in a bottle multiply fast at first, then level off as food and room run short. Von Foerster argued that humans are different, because we cooperate.
More people means more hands and more minds: more people to invent, to share what works, to fight famine and disease together. In the paper's words, a bigger population can form a more versatile and effective coalition against the hazards of its world. Every extra person makes survival a little easier for the next.
Follow that feedback loop to the end, and you do not get a famine. You get something stranger. The authors put it in two short sentences that the newspapers loved.
"Our great-great-grandchildren will not starve to death. They will be squeezed to death."
It was a jab at the followers of Malthus, who had warned for a century and a half that the food would run out. The paper even sorted people into two camps. Pessimists, it said, were "Malthusians by profession". Optimists were "Malthusians at heart".
The authors did not stop at the maths. To dodge doomsday, they wrote, the population had to be held steady, which meant families of "just a little above two children". They floated heavy taxes on large families. And 3 years after Sputnik, they ruled out escaping into space: no re-entry permit to Earth, they joked, could be given to these "space-trotters".
Manifestly Absurd
The paper was a sensation. Time magazine covered it, and so did The New York Times. The cartoonist Walt Kelly put it into his comic strip, Pogo.
Many scientists were not amused. Mathematicians and demographers wrote to Science, calling the work "ridiculous", and "manifestly absurd". And there is an obvious objection. Population is not a law of physics. People make choices, and a curve fitted to the past cannot know what people will decide next.
The authors were not cowed. They answered their critics and stood by their maths. In 1962 they published a reply in Science, with a title that drew a careful line: "Projections" versus "Forecasts".
And then something awkward happened for the critics. The curve kept working. Through the 1970s and 80s, the real population stayed close to the doomsday line, closer than most of the demographers' own forecasts. In 1975, the mathematician James Serrin asked in Science: is doomsday on target? In 1987, another paper's title answered: still ahead of schedule.
Doomsday found its way into textbooks of genetics, ecology and demography. In 1963, a witness before a Canadian parliamentary committee even used it to argue for chemical pesticides. For a generation, many people took it at face value.
The Belgian Curve
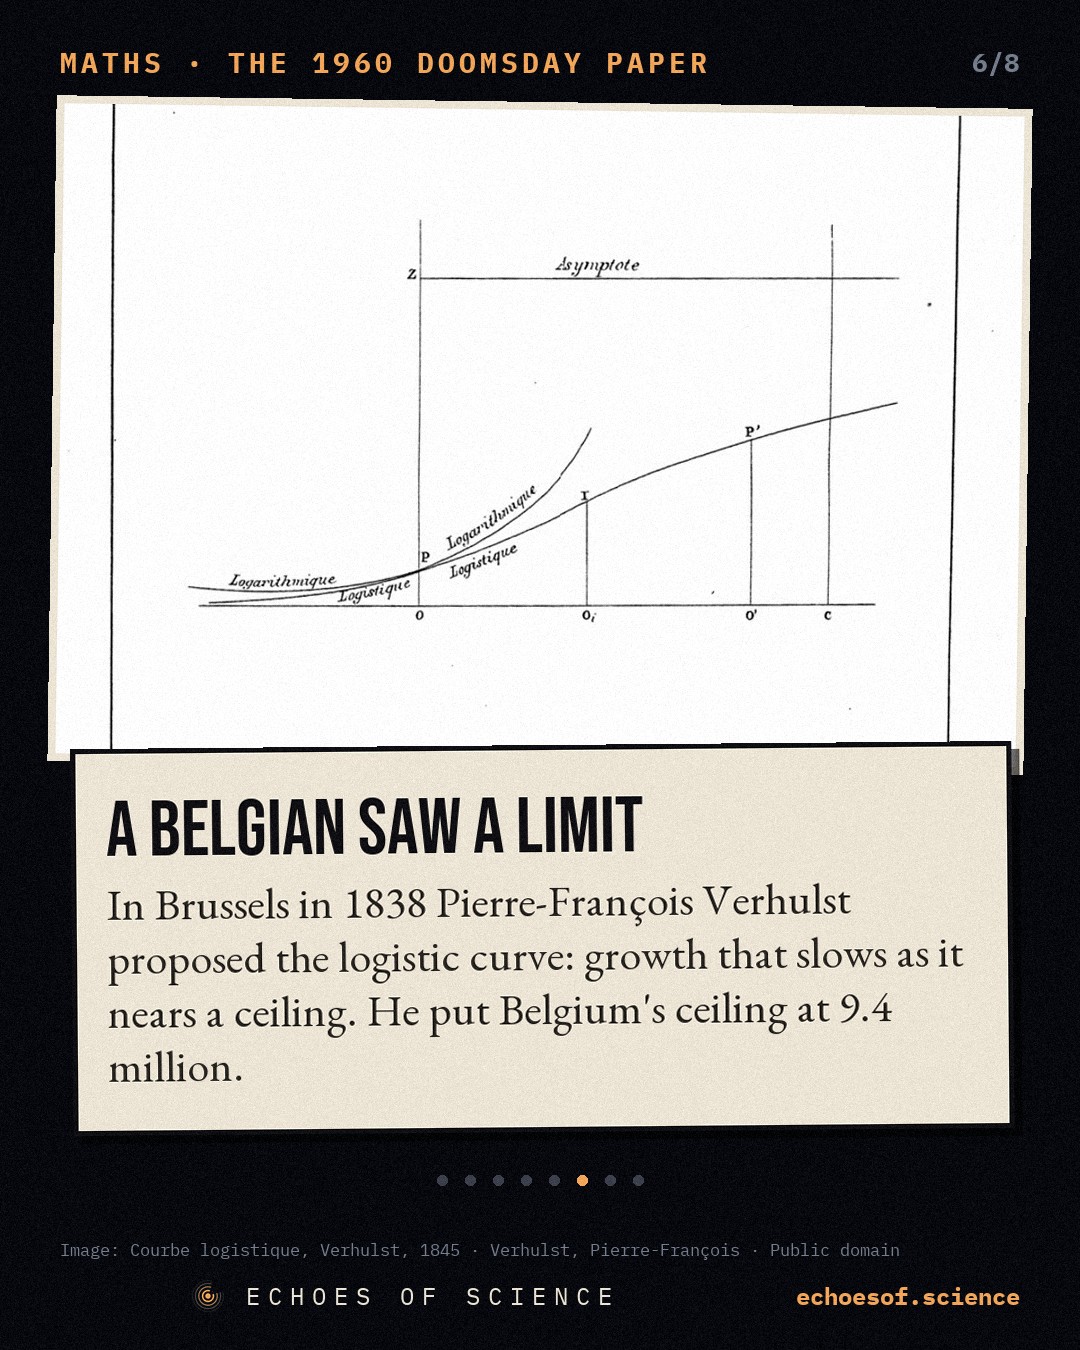
But there had always been another way to draw the future, and it was first drawn in Brussels. In 1838, a young mathematician named Pierre-François Verhulst, a student of the statistician Adolphe Quetelet, wrote a short paper on the law that a population follows as it grows.
Verhulst agreed that growth starts out geometric. But he added a brake. As a population fills its land, growth has to slow, until the number creeps closer and closer to a steady state. He later named his curve the logistic. Today we call its shape the S-curve.
Verhulst even put a number on his own country. Belgium, he predicted, would level off at about 9.4 million people. It passed 10 million in the late 20th century, helped by immigration. Not bad, for a forecast made 150 years earlier.
For decades the logistic curve was ignored, until two American scientists, Raymond Pearl and Lowell Reed, rediscovered it in 1920. It became the classic picture of a population meeting its limits: yeast in a vat, flies in a bottle.
So by 1960 there were three curves on the table. Malthus's exponential, which grows forever at a steady pace. Verhulst's logistic, which bends and levels off. And von Foerster's hyperbola, which bends the other way, upwards, and hits a wall. The only question was which one humanity was on.
How Do We Know?
Today we know, because the counting got far better. Almost every country now runs a census, and the United Nations Population Division combines them into one estimate for the whole world, revised every 2 years.
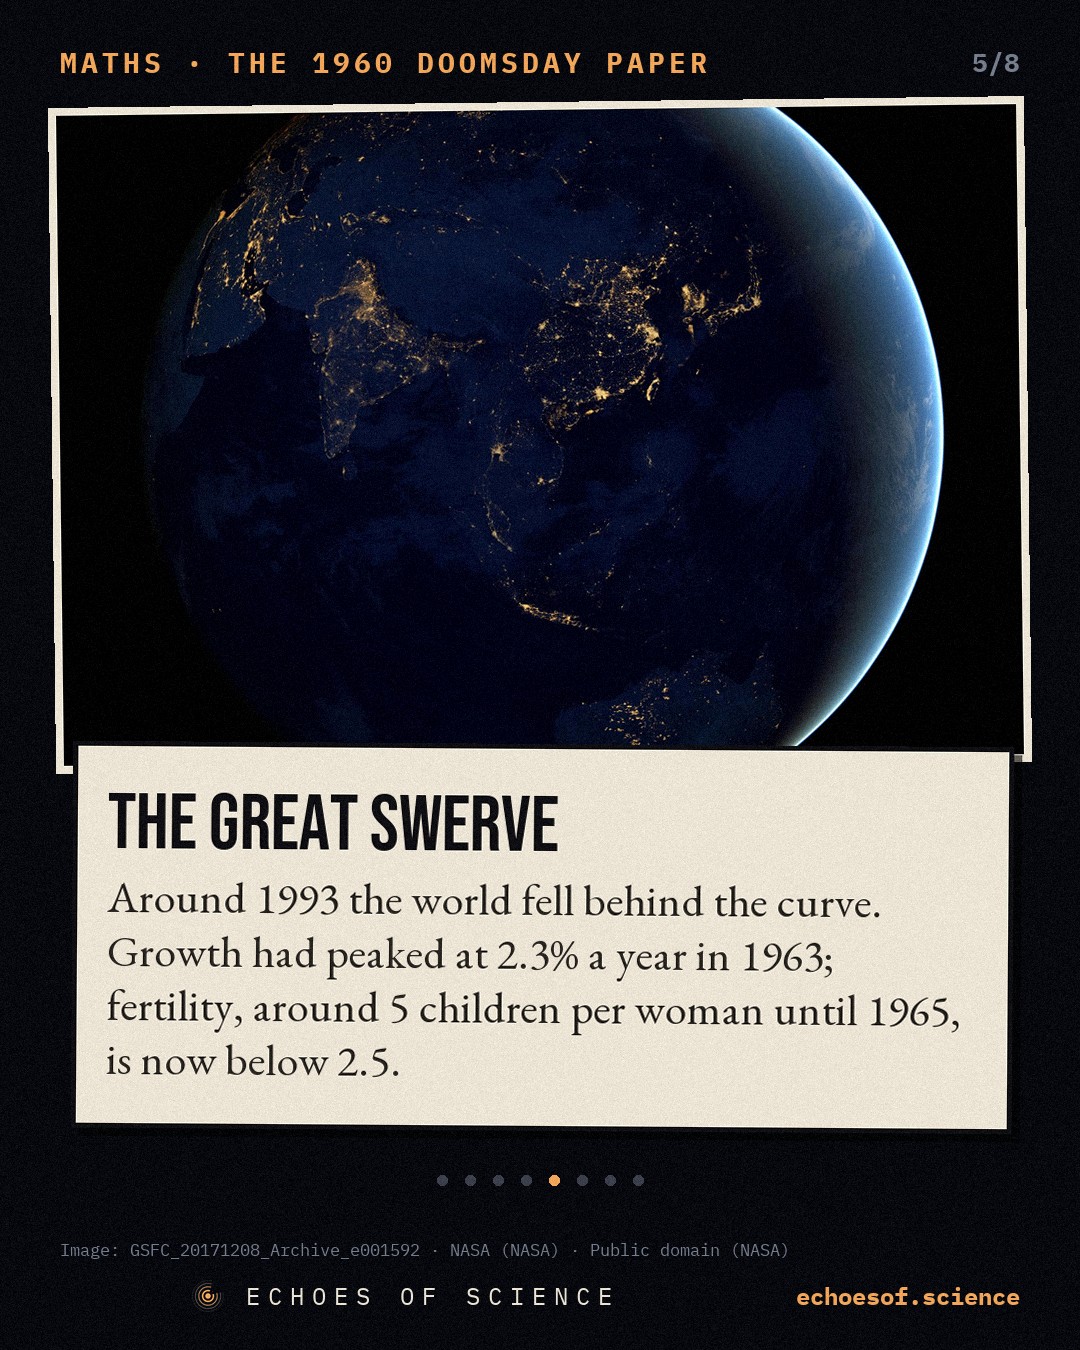
And those numbers show a turning point. Not in 2026, but in 1963. That year, the world's population grew by about 2.3%. It has never grown that fast since. Today it grows by less than 1% a year.
The doomsday curve held on for a while, because a young population that has already had its children keeps growing for decades. But around 1993, roughly halfway between the paper and doomsday, the real world began to fall behind the line. It never caught up.
Run the equation to the start of this year, and it gives more than 200 billion people. By this month, it heads for infinity. The real figure is about 8.3 billion. Humanity passed 8 billion on 15 November 2022. That is a lot of people. But it is not infinite, and nobody is being squeezed to death.
So was von Foerster simply wrong? Not quite. In 1993, the economist Michael Kremer studied a million years of population history and found that, for most of it, the growth rate really did rise with the size of the population. More people, more ideas, faster growth. The population expert Joel Cohen put it neatly: they were "right looking backward, but wrong looking forward".
We should be honest about the uncertainty, too. The oldest figures in the paper are guesses, and historians still argue about how many people were alive 2,000 years ago. A different set of guesses would give a different doomsday. The pattern was real. The date was only ever as good as the assumption behind it.
The Great Swerve
So what broke the feedback loop? Surprisingly, it starts with fewer deaths. For most of history, a huge share of children died young. In Sweden before 1800, more than 1 baby in 5 died before its first birthday.
When better food, clean water and medicine arrived, more children survived, and populations boomed. But a generation or two later, families changed. When parents can expect their children to live, they tend to have fewer of them. Demographers call this the demographic transition. The boom turned out to be temporary.
And it happened far faster than anyone in 1960 expected. In the 19th century, Britain took about 95 years to go from more than 6 children per woman to fewer than 3. Iran made the same drop in about 10 years. China, in about 11.
In Bangladesh in the early 1970s, women had nearly 7 children on average. By 2020, it was 2. Part of that story began in Matlab, a rural area where, from 1977, health workers visited married women at home to offer family planning. The national programme copied it: door to door, woman to woman. Imams were trained to explain that Islam does not forbid it.
Worldwide, the fertility rate was about 5 children per woman until 1965. It has roughly halved since. The UN puts it at about 2.25. More than half of all countries are now below the replacement level of about 2.1. In South Korea, it fell to 0.72 in 2023, the lowest in the world.
Green Revolution crops fed the growing cities. The contraceptive pill gave couples a choice. City life made large families expensive. The feedback loop that von Foerster saw was real. What his equation left out was that people, once they survive, decide.
Why It Matters Today
So on Friday, 13 November 2026, the world will not end. The UN expects the population to keep growing for about 60 more years, to a peak of around 10.3 billion in the mid-2080s, and then to fall slowly.
In some countries the worry has already flipped, from too many children to too few, from crowding to ageing. The question is no longer whether we will be squeezed to death, but how to look after a world that is getting older.
But the doomsday paper leaves a sharper lesson, about curves. When a model says something will reach infinity on a particular day, the model is telling you where it breaks. The same kind of runaway curve now turns up in arguments about technology and artificial intelligence. Each time, it is worth asking: what would make people change course?
And there is one more twist. The historian Alan MacEachern points out that the world did, partly, what the authors urged. The global birth rate today is a little less than half what it was in 1960. Sometimes a warning is worth the most when it fails to come true.
Epilogue
Heinz von Foerster died in 2002, aged 90. On 13 November 2026, he would have turned 115. His curve will not hit its wall that day. About 8 billion of us will still be here to notice. And that is the best way for a doomsday to go.
The science in this story
Key facts
- On 4 November 1960 Science published 'Doomsday: Friday, 13 November, A.D. 2026' by Heinz von Foerster, Patricia M. Mora and Lawrence W. Amiot of the University of Illinois, built on 24 estimates of world population from the past 2,000 years. source ↗
- Their least-squares fit put the date at A.D. 2026.87 ± 5.50 years, with a doubling time that shrinks as population grows; the paper says Charlemagne could have predicted doomsday 'within 300 years', Napoleon within 30. source ↗
- The paper's best-known lines: 'Our great-great-grandchildren will not starve to death. They will be squeezed to death.' source ↗
- Letters to Science called it 'ridiculous' and 'manifestly absurd', yet its projections were more accurate than most demographers' forecasts through the 1970s and 1980s; around 1993 world population began falling behind. source ↗
- Von Foerster was born in Vienna on 13 November 1911; whether that influenced the choice of day is not documented. source ↗
- World population growth peaked at 2.3% a year in 1963; global fertility was around 5 children per woman until 1965 and is now below 2.5. source ↗
- In Brussels in 1838 Pierre-François Verhulst proposed the logistic curve and put Belgium's upper limit at 9.4 million; Pearl and Reed rediscovered it in 1920. source ↗
- The UN's 2024 projections show a peak of about 10.3 billion people in the mid-2080s and about 10.2 billion in 2100. source ↗
In pictures
Loading the quiz…
Sources
- von Foerster, Mora & Amiot (1960), Doomsday: Friday, 13 November, A.D. 2026, Science 132
- A. MacEachern, The Conversation (Oct 2026)
- UN World Population Prospects 2024; Our World in Data (fertility, demographic transition)
- M. Kremer (1993), Quarterly Journal of Economics 108(3)
- P.-F. Verhulst (1838); MacTutor, Univ. of St Andrews
- World Bank: Bangladesh family planning; Statistics Korea
Where every picture, clip and sound in this story comes from
Keep scrolling: more true stories ↓
New mini-documentaries every week and a true story every day. Pick where you like to watch:
▶ Subscribe on YouTube Telegram TikTok Instagram Bluesky Threads ✉ Weekly email